Join today and choose a free book from our collection of 30 titles, valued at $150
Frequently Asked Questions
From “Trading with Selene’s Chariot”
A Financial Astronomy Course
By Sean Erikson

Introduction
We have found that many of the most common questions regarding this course are asked frequently by different people. Below we have compiled a list of answers to those questions to help clarify the intent and approach to the course.
We will continue to add to this section as more questions arise. If there is a specific question you have which you do not see answered here, please contact us and we will ask Sean to answer it.
Book Related Questions
As a trader I'm looking for practical and usable tools I can trade with, not airy fairy stuff that is so complicated it renders itself useless as far as trading goes.
Yes, these are not airy fairy, they are the best trend/swing following tools we have seen. What Erikson is showing in his sample trades is what these tools do on every swing. Those are the real tools he’s showing there too. These are the most powerful, beautiful and effective lines I have ever seen. The way the tools project the slope of each trend is a simply amazing, a truly brilliant insight! You will be amazed to see how this tool projects the slope of the next trend BEFORE it happened and defines the channel that the market moves through almost every time! It's a beautiful thing! We believe Erikson has found and explained the influence that is behind and controlling all market trends! It’s pure genius, and the advantage it provides in trading gives a significant edge over those who are not privy to this knowledge.
It sounds like the book can be digested pretty much over a long weekend, the math and its implementation being straightforward enough. So, I just wanted to verify that that is indeed the case?
Yes, this is true! Trading with Selene’s Chariot a smooth, clean read that is not overly technical, is well-illustrated with charts at every step, and is a thoroughly enjoyable text. One of our customers who has struggled with the technical difficulty of some past texts commented about Selene’s Chariot, “I'm loving his writing style! He's the most laid back writer you've had yet…” The author has a good sense of humor and lots of trading experience which combine into an engaging discussion and analysis of the tools and their application to the markets.
Does the author discuss risk management when trading with these methods?
I do discuss risk, and it is always defined with these methods. There's a whole chapter on how to approach risk/reward from a different perspective than what most traders are probably used to.
I would like to get some sort of understanding of how these tools work with respect to winning percentage. I don’t need audited or exact numbers, but just a general sense of how it performs. I was hoping to find out if the winning percentage with this method is closer to Gann’s historical 80 + percentage, or closer to the 40-60% rate more common with mechanical, technically based systems. It’s possible to be profitable either way but the higher the win rate the (typically) more limited the drawdown. To equalize the drawdown with the lower win% methods, you need to reduce the bet size (and subsequently the return). Also, with a higher win% you can know if it’s off the rails sooner. That’s why Gann said if you have three losses in a row, you’re doing something wrong - it’s just the binomial distribution. I would be satisfied if he has a ballpark number from his own trading. He seems like a no BS guy and I’m old enough to understand my mileage may vary.
[Sean Erikson] Ok, on the accuracy question… I don’t mean this personally, but I can always tell how good a trader is by how this question is asked. Beginner traders tend to believe that accuracy stands alone and is the be-all and end-all statistic that defines any trading method. Professional traders tend to place less emphasis on accuracy, and much more emphasis on risk management. In fact, the point at which that happens is often highly correlated with the point at which a trader passes into overall profitability. Institutional traders don't give two shits about accuracy and focus much more on the shape of the equity curve and various risk metrics associated with it.
Here's a simple example. Let's say we're coming up to a resistance level, and we short it. What do we do with our stop? We can either have a very tight stop, or we can have a very loose one. The tight stop is going to get hit more often and reduce our accuracy. On the other hand, our average losses will be smaller. The large stop will get hit less frequently, so we will take more winners, but when it does get hit, it will hurt. The larger the stop is, the more it will hurt, but the less often it will happen. All of this is common sense, right? There's no magic to it.
So, regarding accuracy, it's related to how much risk you're willing to accept and the win/loss ratio you are seeking. In my early days, before I knew what I was doing, I focused completely on high accuracy. To make this happen, I took quick profits, and had huge stops. When I traded Bond futures, my accuracy was over 90%. I didn't take a single loss for a period of around 14 months. But then, I did take a loss, and that one loss erased the profits of the last ten trades. Then, on the very next trade, I took a second loss, which is when I stopped trading Bonds. That's the price you pay for accuracy. There's no way around this, it works like math. It also means you can tune the accuracy numbers with different risk management strategies, which isn't something most people tend to realize.
Coming back to your comment about drawdowns, you've got it backwards. The worst drawdowns will happen with the high accuracy methods, not the low ones. You think Gann was immune to this, with his high accuracy? Nobody talks about his losses for some reason, or the times he blew out his account. Gann educators tend to gloss over those points, but they are there. How many times did Jesse Livermore blow up? Or modern greats? LTCM (Long Term Capital Management) is the perfect example. Those guys solved the markets, up until the point when they hadn't, and then they went completely under. It's like doubling your bet in a casino with a martingale approach or scale trading. You will have 100% accuracy for as long as it takes until you lose everything.
Anyway, if you are trying to target the "ideal" trading system, I would recommend revising the holy grail to be this: 50% accuracy, with at least a 2:1 risk/loss ratio. Surprise! Not as sexy as what the Gann educators like to push, is it? But you'll make more money than any of them if you adopt that approach. Drawdowns will happen, but they'll be easy to climb out of, and your chance of having a heart attack after a loss will decrease dramatically.
Now that I've said all that, I'll answer your accuracy question! As I said, in the past, when I was young and stupid, I got 90% accuracy. Nowadays I get in the neighborhood of 50-60% if I'm day-trading, and probably 60-70% otherwise. Hope that helps…
I've read through the FAQ, they did answer some of my questions, however I want to get a better feel for the system, and i wanted to see how the losses worked for you. Can you show some samples losses.I'm interested in risk multiples, so I don't care much for the %win, I can more about how many risk multiples the system can make. You don't talk much about stops in your setups and you didn't show many examples if any of stops, and that to me is most important, I want to see how it fails, and particularly on shorter intraday timeframes for ES.
[Sean Erikson] I like it when people ask about things like risk multiples and stops! Usually it's the accuracy question. :-)
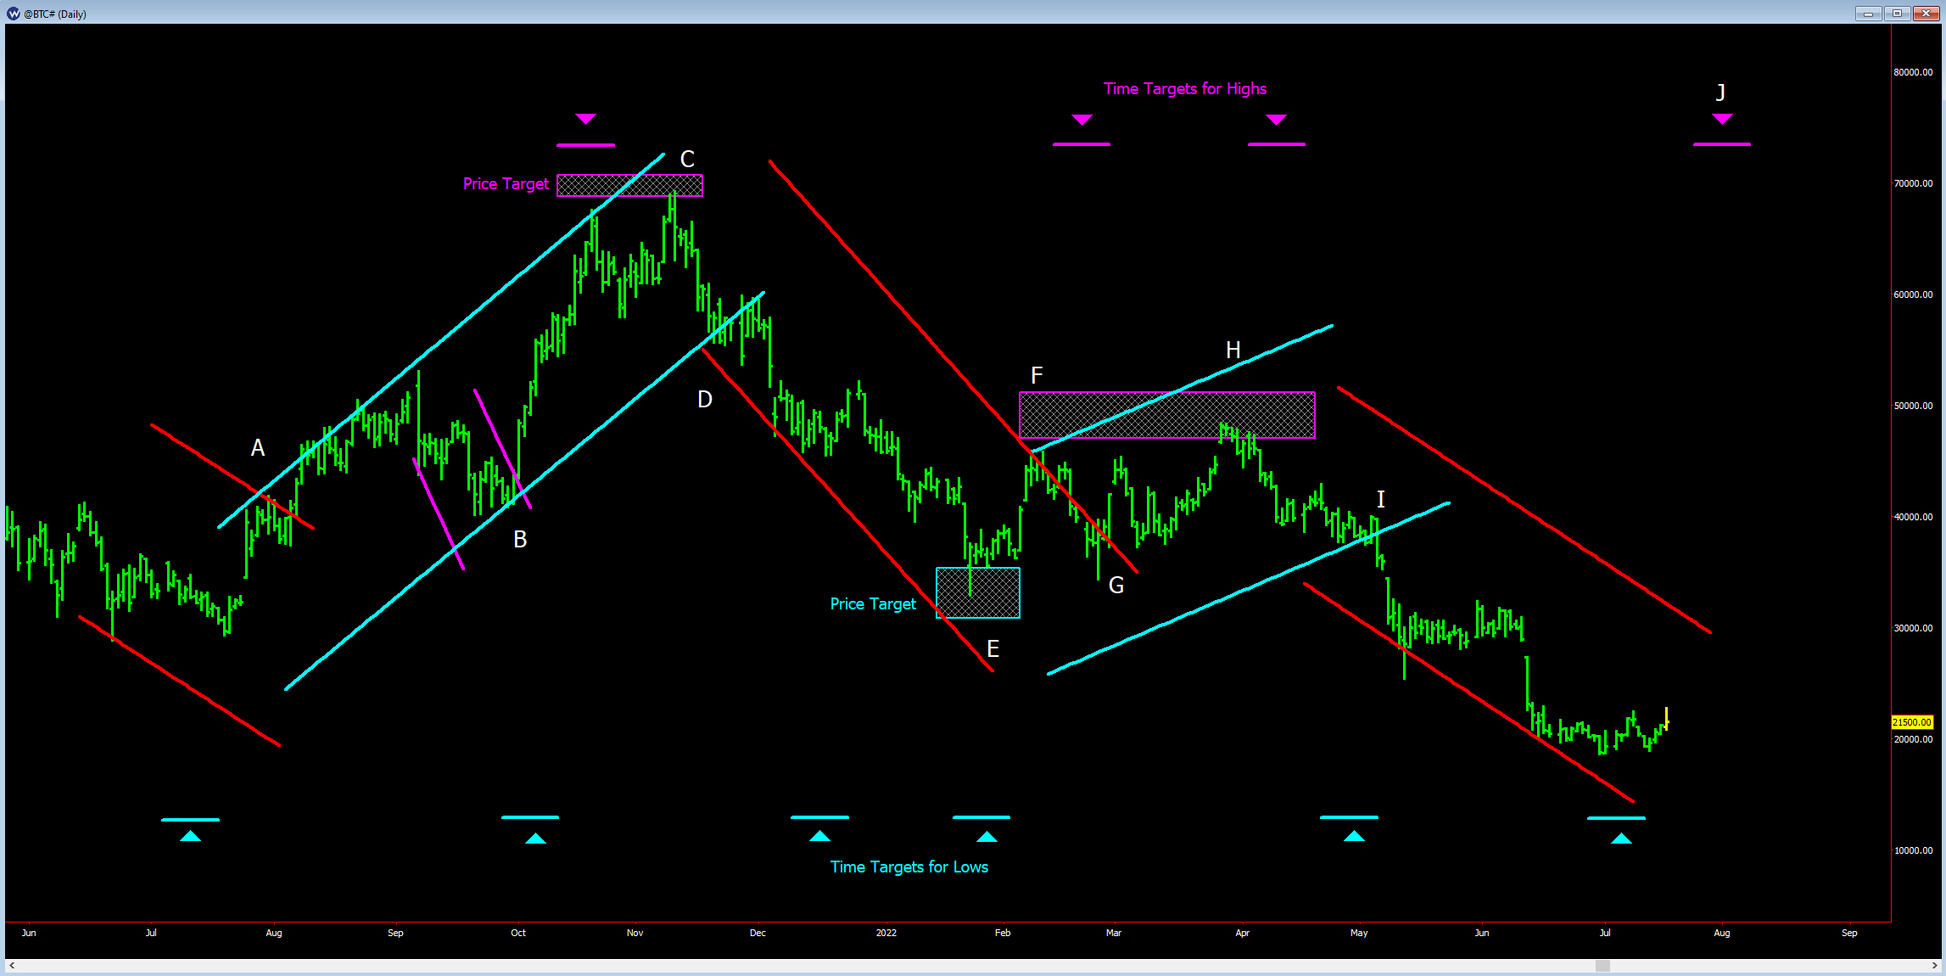
This course is not presented as a mechanical system, with hard rules to follow. It's more about placing the channels/tubes, and solving for the flow. Having said that, I've done my best to include specific trading rules according to how I think this should be traded, and there are many trading examples in the book with explicit entry/stop/exit rules. A lot of that is based on certain features of the approach which I'm not totally comfortable posting publicly, but in general, wins are always a lot larger than losses, which in my mind is key to being able to keep your sanity while trading intraday. Makes it very easy to climb out of holes, and lends itself to a great upward-sloping equity curve. I'll give you a trading example from yesterday, with rules taken straight out of the book:
On the following chart, I've removed of all the analysis and just left in the trading part. I've color-coded this to try and make it easier to follow.
1) We open, drop a little, then find our first setup. Had we been trading a 24-hour chart, we'd probably already be doing something here, but plenty of traders (including myself) like to just focus on the day session. Anyway, there was a downward channel that we would have been following, and the market broke to the upside at the first blue arrow against the light blue lines. I marked the place where you'd definitely want to have been long. There's a stop that goes with that entry (always!) and we would have been stopped in the next 10-15 minutes, which is how losses usually happen. Stops are always pre-defined, and usually amount to about one bar's width. The ES has been volatile, so yesterday that was 4.5 points.
2) The stop happened as we broke out of a very short tube, and (based on some other stuff) if we were on our toes, we'd have been looking for this possibility. We could have stopped and reversed, or stopped, then reversed at the close. That second method is more conservative, and gives a worse entry, so let's do that with this example. I didn't mark it on the chart, but the stop-loss here is one tick above that bar that triggered the entry, so another 4 or 5 points, depending on where you got in.
3) The market moves along, and we start hitting our targets. These were calculated ahead of time, back before we entered, so we knew what our risk:reward would have been. You always get multiple targets, but you don't always hit them, so what I do is take off a little at a time. Usually in thirds, first at target 1, next at target 2, and let the rest run the entire length of the tube for the "home run" style trades. If you have a smaller account and are trading one-lots, then you're a little stuck and have to figure out where to get out. The first target is the yellow line at +9.25, which is at 2:1, the next target is in that rectangle at the low. If you take the middle of it, that gives you +20, or 4:1, and the final trend ended when we broke that downward sloping yellow line for +14.25, or 3:1. So, on average, you took both a loss and a win on this day, and the win was around 3x larger than the loss.
Hope that helps. I like big volatile days, and the most boring tend to be the flat days. Those flat days tend not to necessarily be losers though, but more like getting long and sitting there as the market squeaks out +2 points or something. With this approach, you're always trading with the trend, and so things tend to work out in your favor assuming you are keeping on top of things and going with the flow like you're supposed to.
Software & App Related Questions
In the past I have been a user of Wave59, however as I have a unix programming background a few years ago I wrote my own charting application which runs on MacOS. So, is it a requirement to have the Wave59 software in order to use Sean’s channels, or is the full math provided for in the book in which case I can just drop it into my own charting application and be on my way?
[Sean Erikson] The tools and calculations are fully disclosed in the book. The issue with other software programs is three-fold. First, you have to be able to access astro data from within the programming language. That's sometimes harder than it sounds. Second, you need to be able to scale your chart where X units of times corresponds to Y units of price, square scaling, in other words. For whatever reason, most modern charting platforms are not built that way.
Finally (and most difficult), the helper tools require overlay-style geometry, in other words, a special geometric shape that can be dragged around, rotated on its axis and resized. Wave59 is the only program that I’m aware of that can perform that function. Having said that, if you get the first two solved somewhere else, you can probably get by if you are willing to hold up clear plastic sheets to your monitor and have a number of different sizes of those at hand. Not the easiest way to go about it, but that's what I used to do 20 years ago when I was on TradeStation, and it works.
My immediate concern is the tools and having now to switch to Wave59. Most of the US trading platforms don't cover international markets very well. I find eSignal the best when it comes to exploring multiple markets, something they seem to have mastered well. Does Wave59 have a range of data options that a user can connect if they already have that feed set up?
[ICE] We are currently looking into whether there are any other software platforms that are equally capable of handling these tools, but it will take some time to find someone who can convert or program them on those other platforms, if they exist. There are other options like Microsoft Excel which can do most anything if you know how to use them, but most other trading platforms just do not have the capability, no ephemeris, no ability to manipulate and move geometrical shapes, etc.
But W59 is able to import most any mainstream data source that most people use, and they have their own professional level data feed. External feeds that are currently available in Wave59 include: eSignal, CQG, IQFeed, Kraken, Interactive Brokers, Metastock Xenith, Oanda, Google and Yahoo. One can also load historical data files of most standard formats to use in the software.
Wave59 offers their Pro2 software (with connection to an external data feed) for a monthly subscription price of USD $99. You mention on your website that SSI customers will get some extra deals with Wave59 when they buy the course. What are these deals exactly?
[ICE] We have arranged with Wave59 to provide a 25% discount on the full purchase of the Wave59 software package for all Selene’s Chariot owners. This is the best, if not the only discount that has ever been offered on the Wave59 package, so we extend our hearty thanks to them for their generous offer! Aside from that, Sean agreed to provide the tools for free to everyone who has or gets Wave59, so there are no extra charges for this very sophisticated toolkit. The electronic scripts that Sean provides with the course open up with a double-click in the Wave59 tool list and are ready to use right away.
Can the tools and analysis taught in this course be done by hand on hand charts?
[ICE] It is not too difficult to do by hand if you do hand charts. Actually, the application of the main tool is very simple and the geometry to create the channel and the projection levels are also quite simple, and if you are trading on the daily level, should be no problem. You can apply the tools by hand, on hand carts even, they are not difficult, and the full math is explained. I have one client who has his own software he wrote, so for him, with the details explained he can convert the script for his system, which has the capacity to do it, but it has to have astro, geometry, and other tricky features. the tools are just simple and clean and not hard to do by hand even…
If you’re getting down to lower intra-day levels, obviously it becomes a lot of work to chart. Also, if you had chart, if you have not originally squared your charts, you may have to do some rescaling to set it correctly.
Ultimately, having the software will do it is the easiest once you know you want to use it. W59 has a $99/mo option if you have your own data feed (it probably takes CQG data input) so for critical tools, it’s probably worth investing in. I want to explore some other programming options to see if we can have it available elsewhere, but it may take some programing which would produce extra costs on those platforms.
Questions About the Tools
Thanks for sharing the examples. One quick clarification I wanted to get - when these channels are drawn, are there only 2 specific "hard-coded" lines for every channel? Or, are there multiple "harmonics" of channels, kinda like the "sliding parallel" of Alan Andrews?
[ICE] No, the lines are set and locked! There are the 2 options for placement, the more difficult one that you can do from the turn, vs. waiting and using a swing to lock onto. But once they are set, that’s it!
The only cases where they change is with large changes in volatility, when you had a HUGE channel that then transitions into a tight channel or vice versa. That is a special case where the lines for the channel may turn out to be way too big or way too small. Erikson explains how to readjust it when this happens, but it’s not super common, maybe 1 out of 10. See the next question for more.
Bu yes, what can be annoying about Andrews lines and other such is there are always more lines, they are just like endless theoretical resistance levels. That is what makes these tools so sweet and powerful. There are very few lines that it generates, really just the one key slope line. Then the channel lines are mirrors of it, and when broken (closed over) your trend changes…
There are also 2 primary price projection lines a standard and extended and they handle most price projections with just those 2 price lines.
I would imagine the channels would have to be resized to take into account the increased volatility, but then are you left guessing as to *how* much wider the channels should be, or is there a mathematical solution to the problem which reduces the amount of guesswork involved?
[ICE] No, it’s not guesswork, there is a mathematical solution to it which is very simple. Since we still know the slope, we just have to adjust the range of the channel, but there are super clear points you can just zoom out to get a sort of higher harmonic of that the narrower channel. It's not too complex, and if you missed it, you get stopped on one side and have a HUGE fantastic move on the other, so for the frequency of such things, it's not an issue and there's an easy answer…
The slope line or channel line is not always a constant sloping line. The slope accelerates in an accelerating market or loosens in a market where momentum or intensity slackens. So, it's not one straight line from one end to another, but one has to adjust the angle up or down though in the same direction. If Sean seeks to derive price and time points in the chart and subsequently connects them with a channel, then it's not a challenge as the line is only derived later from 'bounce points' (apologies for using my own terminology). However, if he seeks to first come up with channel and then derives 'bounce points', then we are in for a challenge since we are making a over-simplified assumption that the channel is always within two parallel and straight running lines without accommodating change in slope and momentum of the forces determining the price channel.
[ICE] Actually, all moves do have a consistent slope angle. A much longer move is made up of multiple smaller pieces, up and down, so it will be composed of multiple slope lines which makes up the larger curve that you see. All curves in nature are actual comprised of geometrical units made of straight lines that approximate the curve. The market is the same way… The channel lines are derived BEFORE any bounces, and then the market bounces off of them, even though, for other traders, there is no line in that empty space. Also, a very long channel on a higher level will still usually have a consistent slope or vector that it follows, but the market will move around that slope, wrapping its way around it as it moves between the upper and lower range of the channel.
One nagging uncertainty in all this is the what scaling factor to use for the charts. Different scales yield drastically different results. I was trying to replicate the additional examples that Sean posted (Gold, USO and Bitcoin).
[Sean Erikson] Scaling is obviously very important. There's a sort of "core" scale, that then is multiplied by particular variables to account for volatility. Usually the market will stick with a consistent scale forever, but sometimes you get shifts, which happens in Crude all the time. It's more of an art than a science, but I've done so many of these that I can zero in on good scales in about 30 seconds if it's a market I'm not familiar with. There's a scaling video at Wave59 in the members area where they go over some ways to zero on in good scales, which I recommend watching.
In retrospect, I may have overlooked how confusing scaling might be to people new to the idea of square scaling. If it turns out to be a big hurdle, I'll write up some instructions and post them in the forum. Scaling factors always throw people for a loop. It's a pretty big stumbling block for most Gann analysts too, at least in the beginning when they don’t know that they must square their charts to get the tools to work.
There are many newbies to Gann and geometrical work who have never learned this and as a result all their geometrical work is flawed. I've been doing it for so long that I don't even think about it anymore, so it does get easier. I'll write some tutorials up once the questions start coming in on the forum. It's actually pretty simple to do, and there aren't nearly as many infinite possible solutions as it appears at first. ;-)
But once you find the scale, you'll stick with it. But what happens is that the markets move into high gear during volatile times, and you'll find that your chart doesn't fit very well onscreen anymore unless you really compress it down. You'll see this kind of thing happen in Crude a lot, and also intra-day on the ES, etc. Think of scales as electrons in different energetic orbits around the nucleus of an atom. There are many different orbits that all work, and they're all related. Once you have the core scale for a market, you also have solved for all the orbits that the market will work though, so it's just a matter of figuring out which one you're in. Probably too theoretical… LOL…
I am also intrigued that Dr. Lorrie V. Bennett was to cover the whole range of astrological and planetary influence in her upcoming Planets course, while Sean Erikson says it's mostly about only one planet really. I don't have access yet to either of those and I wouldn't know whether the two concur or have divergent views here!!
[ICE] These are two completely different approaches and orientations. Lorrie IS doing what we would consider to be normal, though advanced ASTROLOGY. Sean is NOT! What he is using is pure astronomy converted into market geometry! They are two completely different approaches and subjects. Lorrie does not know this insight of Erikson’s, though if she did, it would not so much be a part of her Planets course as of Geometry, the final volume. She is actually using horoscopes, birthdates, houses, relational influences and all that goes with the most subtle and complex level of astrology…
So, they are looking at 2 totally different kinds of things “astrologically”, and they don’t conflict, similarly to Muriel Hasbrouck’s work which is also not really doing astrology either. The Hasbrouck’s work sort of falls between Erikson and Bennett, as she is converting the planetary positions into Solar effects related to their Field Forces and propagated through the sun generally. Pure astro doesn’t convert through the sun like that or develop a scientific thesis which explains the propagation of forces and such.
Can you please ask Sean about that Oil example? How exactly did he create that one?
[Sean Erikson] For the Crude example… yes, there are two levels to this book. There's what's in the pages and there's some other stuff that I put in there for kicks to urge people try to solve for more. Most of that was done on purpose, like the final two chapters, but my subconscious did some things all on its own as well, and that chart and a handful of others is an example of that. I hadn't initially meant to include that but left it and the others once I saw what happened because it's part of another experimental technique that wasn’t explicitly discussed.
So, consider it bonus material that you'll only receive if you go through and try to replicate every example (like you're doing - good job, btw). This mostly has to do with an alternative way to solve for time. That's actually a bigger deal than it sounds and a much bigger discussion than just using another time frame than the one I recommended…
Price & Ordering
Sean Erikson
Trading with Selene's Chariot
Predicts the exact slope, breadth and termination points of every trend in every market on every time frame…
A course by Sean Erikson, that presents a set of hig...
Regular price
$6,500.00 USD
Regular price
Sale price
$6,500.00 USD
Unit price
/
per
Tax included.
Shipping calculated at checkout.
Share

WHAT OUR TRADERS SAY…
When I was able to get an early copy of Alex’s 3rd book ‘Music of the Spheres’ I was stunned by the amount and quality of the information he provides. Alex ties together astronomy, music, and correct scaling to provide a glimpse inside the market’s true structure. He clarifies the work W D Gann did a hundred years ago and then brings that work into the modern world where we can adjust scales and track planets with a click of a mouse button.
Mr. Straker is also a gifted and willing mentor if someone wishes to accelerate their learning curve with some one to one work with him.
I have read many books in 30 years of market study and was fortunate to be able to spend hours looking over the W. D. Gann archives in Nikki Jones' possession. I believe Alexander Straker has written material that will go down in history as the truly definitive work on understanding W D Gann. He also has shown how the original Gann methods can be expressed in greater detail with the use of computer chart programs.
Ken Gerber Lambert-Gann Educators, Creator of Natural Squares Calculator
Lorrie has a profound gift of seeing patterns and of perceiving the underlying order within whatever subject she directs her attention towards. Additionally, she has the gift of perceiving not only what is truly being said, but more importantly, what is not. She has taken on the works of W. D. Gann and Dr. Jerome Baumring in a total immersion. Her tenacity, will, and energy have been the sails, the current, and the wind of her voyage through the illusory and sometimes rocky waters of W. D. Gann.
Kenneth Macht
Alex has shared a tremendous amount of knowledge invaluable to Gann students and traders. It is apparent that Alex has studied market behaviour with a great deal of enthusiasm for many years, and given considerable thought to distilling the essence of past and current masters to come up with his own unique theory about how it all fits together around the golden mean. His generosity in sharing his insights is only matched by the number of pages in this insightful volume!
I've covered a lot of material in many years of research, but never have I come across insights which more clearly point to an underlying mathematical structure to price markets which become discernible through proper scaling. Alex's scaling methods and insights are the best I've come across, particularly his angle-based approach. I'm sure that any serious student of Gann would be impressed with the unique insights generously shared by Alex and would find return for their investment in the scaling methodology alone.
Gerald Jaworski VIC Australia, Tool Designer, Programmer & Researcher
Related pages
Sean Erikson – Biography, Courses, Information