Join today and choose a free book from our collection of 30 titles, valued at $150
Sean Erikson
Celestial Mechanics & Ancient Geometry for the Contemporary Trader

About the Author and his Work
Sean Erikson is a former fund manager possessing over 25 years of experience in the research and application of accurate and profitable market forecasting tools led by his own approaches to stock market geometry. Having recently retired, Erikson now teaches advanced trend projecting techniques for traders and fund managers who are seeking a reliable, astro-trading strategy applicable to all markets.
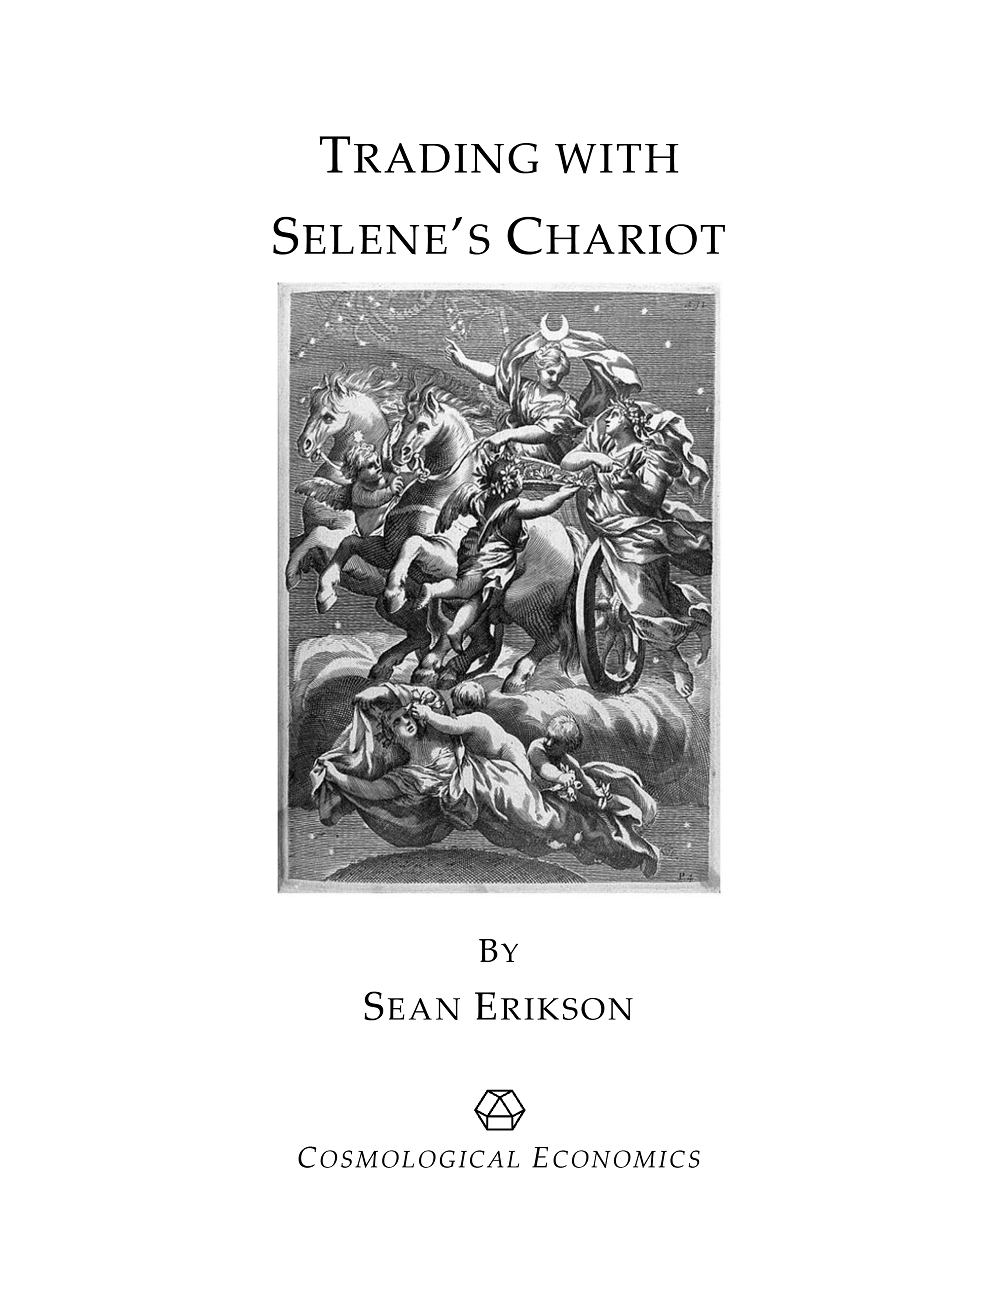
He has presented a set of powerful trading tools used for advanced swing trading techniques based upon the principles of celestial mechanics and ancient geometry. The tools and techniques offered in his course Trading with Selene’s Chariot represent the culmination of a lifetime quest for the ideal astro-trading toolkit.
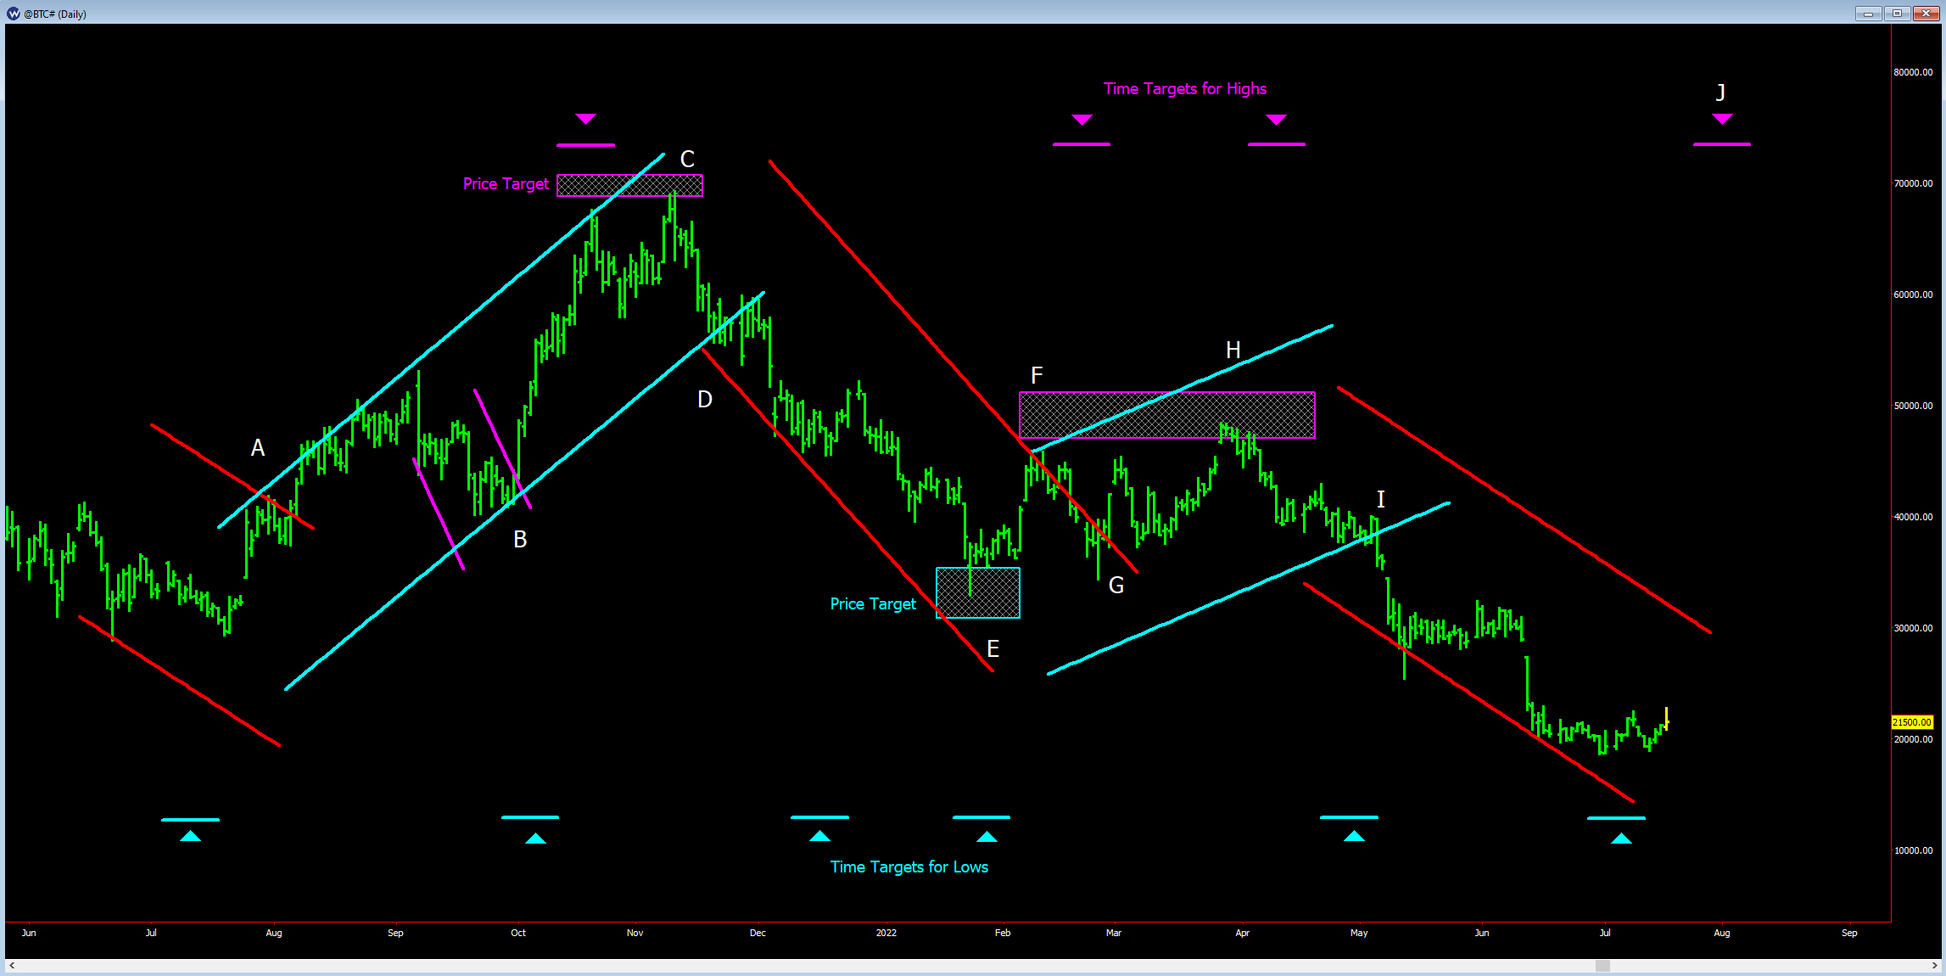
The core tool in his course provides the trader with the capacity to project the exact slope of the forthcoming trend from which a parallel channel is constructed to the angle of attack which will contain the entire movement of the ensuing trend. For a complete account of Sean’s life in the markets we encourage you to read his bio and introduction to Selene’s Chariot.
Publications

Trading & Market Examples from The Book

Since the incredible interest in Bitcoin these last years, and the spectacular rise and fall of this market, many have asked how the Selene's tools performed on the Bitcoin (Futures shown here) market. So, Sean created a longer term Bitcoin chart with Selene's Channels and provided a step by step guide as to how one would have easily traded these huge Bitcoin swings with very little trouble, generating superb profits doing so. The following analysis only uses the simplest approach to applying Selene's tools, staying on only one time level and using the break in the channels as the trade indicators.
Articles & Continuing Research
WHAT OUR TRADERS SAY…
When I was able to get an early copy of Alex’s 3rd book ‘Music of the Spheres’ I was stunned by the amount and quality of the information he provides. Alex ties together astronomy, music, and correct scaling to provide a glimpse inside the market’s true structure. He clarifies the work W D Gann did a hundred years ago and then brings that work into the modern world where we can adjust scales and track planets with a click of a mouse button.
Mr. Straker is also a gifted and willing mentor if someone wishes to accelerate their learning curve with some one to one work with him.
I have read many books in 30 years of market study and was fortunate to be able to spend hours looking over the W. D. Gann archives in Nikki Jones' possession. I believe Alexander Straker has written material that will go down in history as the truly definitive work on understanding W D Gann. He also has shown how the original Gann methods can be expressed in greater detail with the use of computer chart programs.
Lorrie has a profound gift of seeing patterns and of perceiving the underlying order within whatever subject she directs her attention towards. Additionally, she has the gift of perceiving not only what is truly being said, but more importantly, what is not. She has taken on the works of W. D. Gann and Dr. Jerome Baumring in a total immersion. Her tenacity, will, and energy have been the sails, the current, and the wind of her voyage through the illusory and sometimes rocky waters of W. D. Gann.
Alex has shared a tremendous amount of knowledge invaluable to Gann students and traders. It is apparent that Alex has studied market behaviour with a great deal of enthusiasm for many years, and given considerable thought to distilling the essence of past and current masters to come up with his own unique theory about how it all fits together around the golden mean. His generosity in sharing his insights is only matched by the number of pages in this insightful volume!
I've covered a lot of material in many years of research, but never have I come across insights which more clearly point to an underlying mathematical structure to price markets which become discernible through proper scaling. Alex's scaling methods and insights are the best I've come across, particularly his angle-based approach. I'm sure that any serious student of Gann would be impressed with the unique insights generously shared by Alex and would find return for their investment in the scaling methodology alone.
Related pages
You May Also Like
-
 Sean Erikson
Trading with Selene's Chariot
Predicts the exact slope, breadth and termination points of every trend in ...
